Research Question
What is your primary research question?
What was the impact of the Affordable Care Act’s implementation on diabetes and associated mortality rates across NC counties, using county panel data from 2010 to 2016?

North Carolina's county data (2010-2016) show diabetes-related mortality continued to rise after ACA marketplace expansion, with modest relative gains for working-age adults and stronger protection in counties with more primary care.
What is your primary research question?
What was the impact of the Affordable Care Act’s implementation on diabetes and associated mortality rates across NC counties, using county panel data from 2010 to 2016?
To look at the effectiveness of the ACA, the study merged data from several sources to look at how health outcomes related to diabetes were affected by this policy change. Thus, datasets originated from the North Carolina Department of Health and Human Services (NC DHHS), the North Carolina Health Department, the North Carolina Office of State Budget and Management (NC OSBM), the Census Bureau, UNC Sheps Health Center NC data, and the American Community Survey (ACS 1 and ACS 5). The NC state agency datasets provide annually updated county-level counts on mortality by disease type, population, un-insurance rates, and labor-market conditions like unemployment. UNC Sheps Health Center provided measures of health care supply such as primary care presence by county. Finally, Census and ACS datasets provide regularly collected demographic and socioeconomic information (for example, income, education, and insurance coverage), with 1-year estimates captured in larger counties with 65,000 residents or more, and 5-year estimated staggered but insightful data for smaller counties.
See codebook: ACA diabetes county dataset codebook
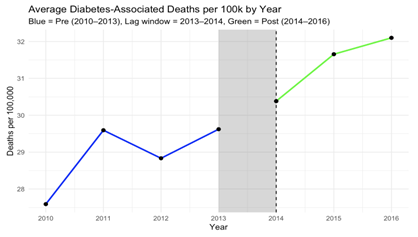
The Affordable Care Act (ACA) dramatically expanded access to health insurance across the United States. In North Carolina, even without Medicaid expansion during this period, more than one million residents gained coverage through the ACA Marketplace from 2013 to 2016. A core promise of the law was that better insurance coverage would improve health outcomes, especially for people with chronic conditions like diabetes and related comorbidities. We built a county-level dataset covering all 100 North Carolina counties from 2010 to 2016, focusing on working-age adults (18-64) and tracking diabetes-related deaths per 100,000 residents. We compared trends before the ACA (2010-2013) to the years after initial implementation (2014-2016), using adults ages 65-99 as a comparison group since they were already covered by Medicare.
At first glance, the results are surprising. Diabetes-associated death rates increased after 2014, even as insurance coverage expanded. This does not mean the ACA caused deaths to rise, but it does challenge the assumption that insurance expansion alone quickly translates into better health outcomes.
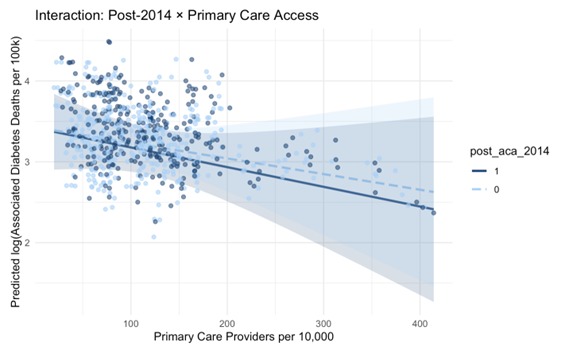
Counties with more primary care providers saw smaller increases in mortality after 2014. After the ACA, higher primary care availability became more protective, especially in counties with stronger health care infrastructure. This suggests that insurance works best when people can actually access care, not just coverage on paper.
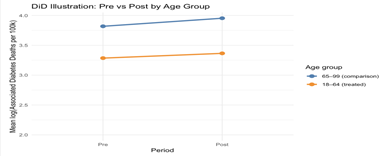
A difference-in-differences comparison shows that while overall mortality rose, working-age adults experienced a modest relative improvement compared to seniors after 2014. This suggests the ACA may have helped the treated group somewhat, even as broader mortality trends remained unfavorable.
So why might deaths rise even as coverage improves? One explanation is detection and timing. More people may have entered the health system after years without care, leading to increased diagnosis and more accurate recording of diabetes-related deaths. Another possibility is capacity strain, especially in rural counties. Insurance expansion increases demand, but without enough clinics and providers, care may be delayed or fragmented. The takeaway is not that the ACA failed, but that insurance is necessary and not sufficient on its own. Expanding coverage without expanding primary care capacity may limit health gains, especially for chronic diseases like diabetes. Coverage works best when the health care system is equipped to support it.
To look at the effectiveness of the ACA, the study merged data from several sources to look at how health outcomes related to diabetes were affected by this policy change. Thus, datasets originated from the North Carolina Department of Health and Human Services (NC DHHS), the North Carolina Health Department, the North Carolina Office of State Budget and Management (NC OSBM), the Census Bureau, UNC Sheps Health Center NC data, and the American Community Survey (ACS 1 and ACS 5). The NC state agency datasets provide annually updated county-level counts on mortality by disease type, population, un-insurance rates, and labor-market conditions like unemployment. UNC Sheps Health Center provided measures of health care supply such as primary care presence by county. Finally, Census and ACS datasets provide regularly collected demographic and socioeconomic information (for example, income, education, and insurance coverage), with 1-year estimates captured in larger counties with 65,000 residents or more, and 5-year estimated staggered but insightful data for smaller counties.
A key data challenge involved missingness in ACS 1-year estimates, particularly for smaller and more rural counties with populations under 65,000. Diagnostic anti-join checks revealed systematic gaps for certain county-year pairs, especially in early years and low-population counties. Because this missingness followed a temporal pattern rather than occurring randomly across counties, we implemented a linear interpolation strategy to retain these observations while preserving within county trends. Interpolation was applied within counties across time using linear approximation, with forward and backward fills at the panel edges where necessary. Interpolated values were flagged for transparency and sensitivity assessment.
Additional data cleaning steps included replacing missing disease death observations with zeroes in cases where NCDHHS does not report a county-year value, consistent with reporting conventions. Variables were normalized to facilitate comparison across counties, including expressing mortality rates per 100,000 residents and provider supply per 10,000 residents. Variables with excessive missingness that could not be reliably imputed were excluded from the final dataset.
The resulting tidy panel dataset balances coverage across counties and years while maintaining consistency with the causal framework. These data preparation steps ensure that subsequent analyses reflect meaningful variation in insurance coverage, access to care, and diabetes outcomes.
The outcome variable was logged to reduce the impact of outliers. Correlation and F-tests were conducted to finalize a list of covariates.
Descriptive and Causal Estimation via DiD and TWFE approaches.
Recreate the Analysis
Use these files to reproduce the ACA mortality analysis and figures.
One email when a new plot drops. No spam.
By subscribing, you agree to our privacy policy.